Purpose: We examine the importance of entropy and how it is relevant in our standard PV diagrams. We also look into diagrams involving entropy and solving these diagrams in a similar manner as our PV diagrams.
The Fan
We examine a sterling engine which runs on temperature difference. The fan spins, showing work is being done.

We decide to switch the temperature reservoirs and, like the experiment with the disk, the fan spins in the opposite direction, again, showing what happens when we switch the reservoirs.
Temperature vs. Entropy Diagram
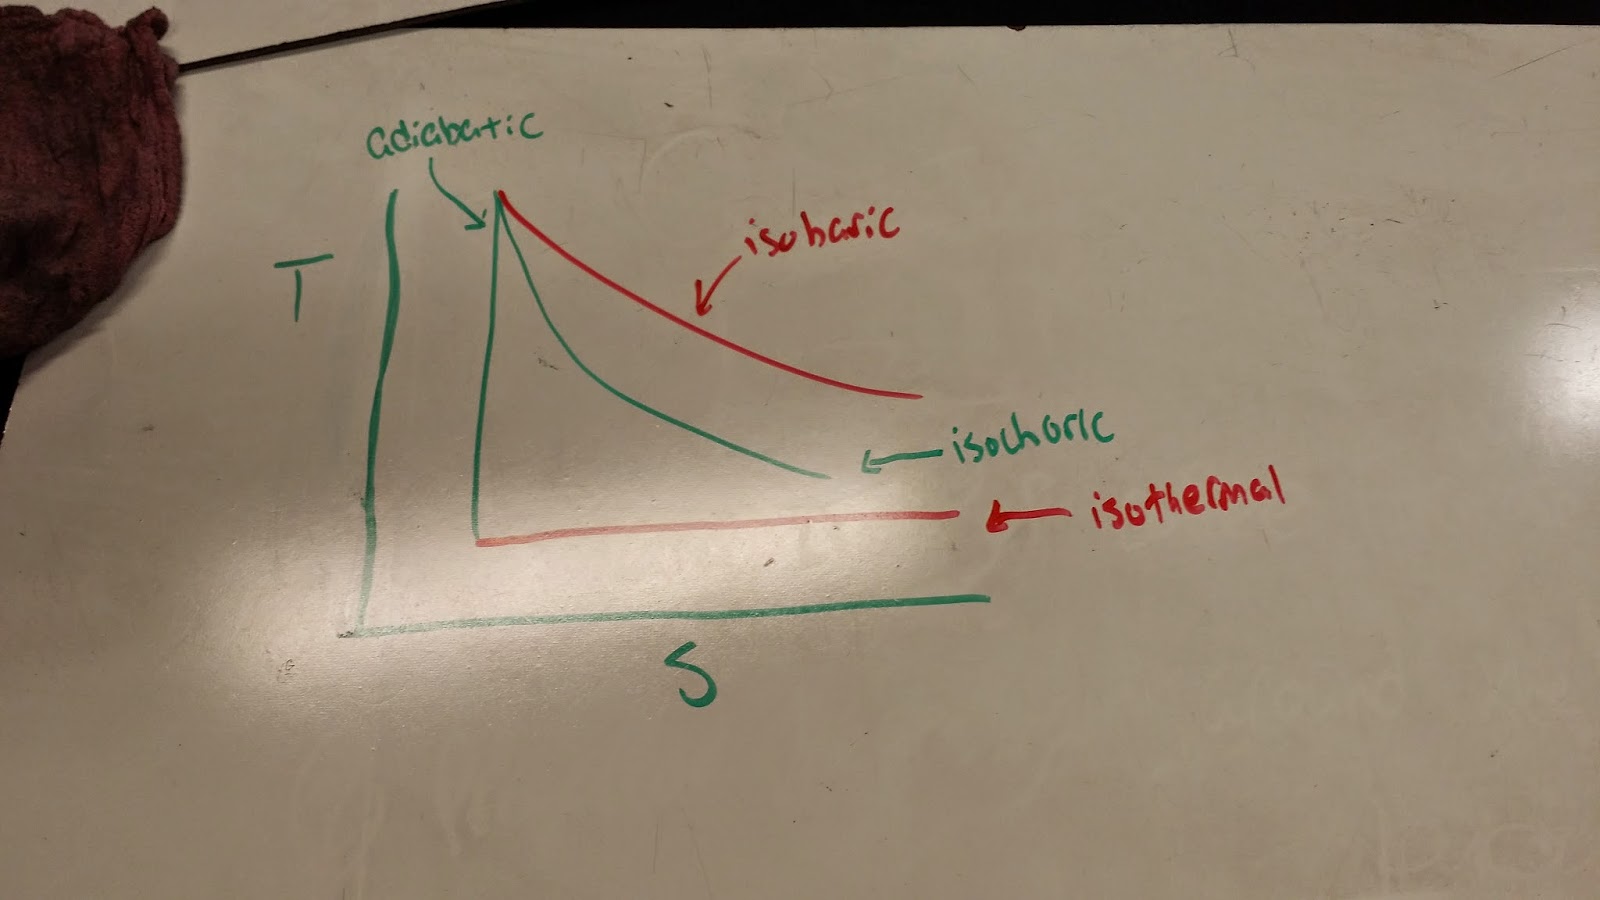
We look at our first temperature versus entropy diagram and see that the diagram looks awfully similar to some standard pressure versus volume diagrams. In a temperature versus entropy diagram, the adiabatic assumes the behavior of the isochoric process and the isothermal process assumes the behavior of the isobaric process and the isochoric and isobaric assume the adiabatic and isothermal behavior, respectively. This makes sense as temperature is constant in isothermal processes and there is no change in heat in an adiabatic processs, causing no change in entropy.
We examine the maximum possible efficiency the sterling engine could produce by calculating the efficiency of a carnot engine. Again, this efficiency is not attainable, but a good theoretical value to make sure are efficiency is reasonable.
The Coefficient of Performance
We use the coefficient of performance to find the heat required to warm a home with the temperature outside being very cold and the temperature inside being room temperature.
How Effective Is It?
We take a look at effectiveness of an engine. Our effectiveness is given by the net work divided by the work of a reversible processes. This, then, translates into the actual efficiency divided by the efficiency of a reversible process.
Zero Change in Entropy
We look at an example where two objects sit next to each other until thermal equilibrium is reached. Both objects have different temperature and the change in entropy is zero. We, then, solve for final temperature.
After we have found our final temperature, we then find the work done. We know that heat is equal to mass time the specific heat times the change in temperature. We also know that work is hot heat minus the cold heat.
Using only the given temperatures, we solve for the coefficient of performance. This allowed us to find the hot Heat.
Finally, we use what we know about heat flow to find the time it takes to freeze something.
Bubbles Experiment
We see that when Professor Mason blows air through a tube, creating a bubble, The bubble immediately falls to the ground because the bubble is more dense than the air.
We see in the second part of the experiment that the bubble rises up. This is because there is no air inside the bubble, as it was replace with a gas less dense than air.
We use a lighter to lit the methane bubble on fire and as we lit it, the flame went upward. This makes sense since we light the bubble from the bottom and it travels in the same direction as the methane gas.
Conclusion: We ventured into entropy as we viewed how a temperature versus entropy diagram looks with the same four processes found in our standard PV diagrams. The difference between the two is that the area in a temperature versus entropy diagram shows us the heat transferred to the gas, not the total work done. We also found the coefficient of performance, a value that similar to the efficiency and a value of effectiveness. Using these, we ventured into practical applications. We finished off by looking at a bubble. One bubble with more density and one bubble with less density. Then, we lit the bubble with less density in flames to observe the direction the flame travels.


No comments:
Post a Comment